Diversifying Your Markets in Uncertain Times: Tools to Help You Choose Wisely

Key takeaways
- Faced with tariffs, Quebec SMEs have three options: indecision, stagnation, or market diversification. Only the third can be planned.
- Companies that pivot quickly usually had a strategy in place before the crisis.
- The BCG matrix tells you what you have, the Ansoff matrix tells you where you can go, and the 4 Ps tell you how to get there.
- A weighted scoring grid, a small-budget pilot, and the 70/30 rule can turn intuition into informed decision-making.
A U.S. client postpones an order. Another asks who will absorb the tariffs. Around the management table, three ideas for new markets have been circulating for weeks, but no one is ready to make the call.
This scenario is playing out in many SMEs. Quebec is particularly exposed because of its longstanding trade relationship with the U.S., and a rebalancing has already begun. According to the Institut de la statistique du Québec, the share of Quebec merchandise exports going to the United States fell from 73.3% in 2024 to 69.8% in 2025, dropping below 70% for the first time since 2020. During the first eleven months of 2025, exports to other countries increased by 9.8%.La Presse
For the leader of an industrial SME, the question is no longer simply whether to move. It is where to go, with what, and in what order. Doing nothing or waiting for the situation to stabilize is also a strategic choice.
This article presents a real client case and the tools we use with our clients to turn an idea for market diversification into a structured decision.
A Real Case: When 60% of Revenue Depends on a Single Market
The context. This Quebec-based family business processes raw materials and has been operating since the beginning of the century. It has 230 employees, a 225,000-square-foot plant, and seven market segments, four of which offer strong growth potential. The company had also recently made major investments in advanced technologies.
The shock. When the tariffs were announced, 60% of the company’s revenue came from exports to the United States. A similar share of its supplies also came from the U.S. Both ends of the value chain were therefore affected at the same time.
The response. The marketing mandate, launched in September, originally called for an April rollout targeting the United States and Latin America. After a pause of roughly three weeks, management decided to move forward, but with a completely different target: Japan, China, and Mexico. The plan had to be adapted to new cultural and business norms, with support from local firms and embassies, while investments continued rather than being frozen.
The shift took a matter of weeks, not years, because diversification efforts were already underway. The company had a strategy, prioritized segments, and a clear vision for growth. Agility is not a personality trait. It is the result of strategic work done in advance. To understand why some approaches never reach this level of preparedness, read “The Top 5 Reasons Strategic Planning Fails”.
Where Should You Start Before Targeting a New Market?
Start with what you already have. When sales slow down, the temptation is to chase the next great idea. That is the shiny object syndrome, and it can be costly in both time and budget.
Two things need to be assessed. First, your foundation: positioning, true added value, and customer segments. Without that foundation, trying to grow is like building on unstable ground. Second, your portfolio: which products are truly profitable, which ones fund the others, and which ones continue to exist simply out of habit? That is where the first tool comes in.
Tool #1: The BCG Matrix — Taking Stock of What You Have
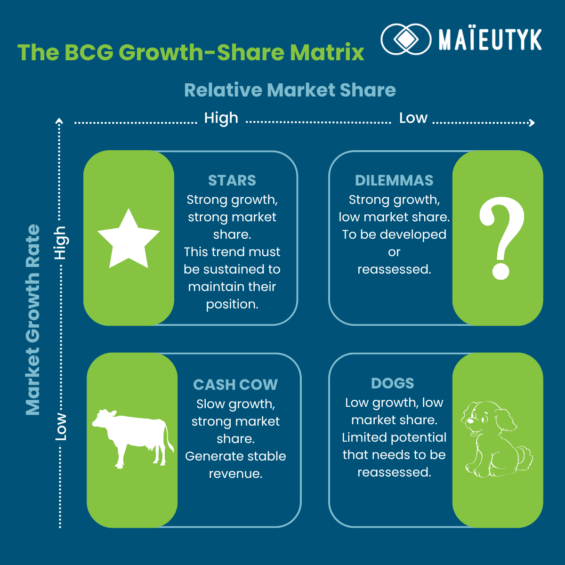
Bruce D. Henderson of Boston Consulting Group (BCG) developed the growth-share matrix in the late 1960s. It helps companies manage a product portfolio and allocate resources where they will generate the most value. It compares market growth with relative market share, resulting in four quadrants:
- Question marks (high growth, low market share) are promising but require significant R&D and market knowledge.
- Stars (high growth, high market share) offer strong potential and require ongoing marketing and sales support.
- Cash cows (low growth, high market share) generate stable revenue with relatively little investment.
- Dogs (low growth, low market share) require a closer look at their role: repositioning, strategic retention, or discontinuation.
The real value of the exercise lies less in the classification itself than in the movement between quadrants. Cash cows fund stars and question marks. Will today’s question marks become tomorrow’s stars?
Two nuances are important. A dog does not necessarily need to be eliminated: it may support a cash cow or find a better fit in another market. And if you cannot clearly identify a cash cow, start with a simple inventory of your products and their profitability.
Key takeaway: before looking for a new market, know which products will fund the expansion.
Tool #2: The Ansoff Matrix — Four Paths to Growth
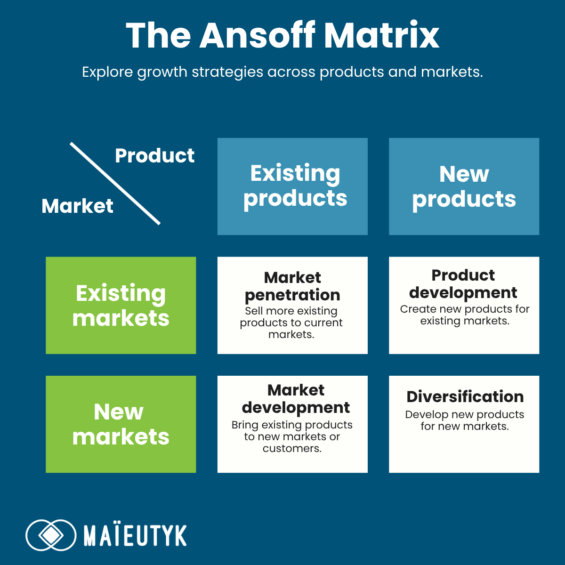
Igor Ansoff introduced this matrix in 1957 in the Harvard Business Review in an article focused on diversification strategies. It compares your products — existing or new — with your markets — existing or new. The key point is that each quadrant requires a completely different marketing approach.
Market penetration: same products, same types of customers. You sell more, and this is where your cash cows do the heaviest lifting.
Product development: new products, same customers. This is often less risky than entering an entirely new market because you already know your customers and their needs. Are your customers buying 100% of your product range? Almost never. And in many cases, it is not because they are saying no — it is because they are unaware of everything you offer. The work required is largely educational.
Market development: same products, new customers, either in a new industry or a new geographic market. No one knows you yet. You need to build awareness, clarify your positioning, and displace competitors that are already established.
Diversification: new products, new customers. This is the highest-risk path, but it can also open up opportunities in areas where competition is limited.
In the case presented above, the company did not move to a different quadrant. It remained in market development. It changed geography, not strategic logic, which is what made the pivot relatively fast.
Key takeaway: the quadrant you choose determines your budget, channels, sales cycle length, and the competitors you need to analyze.
Tool #3: The 4 Ps — How You Will Get There
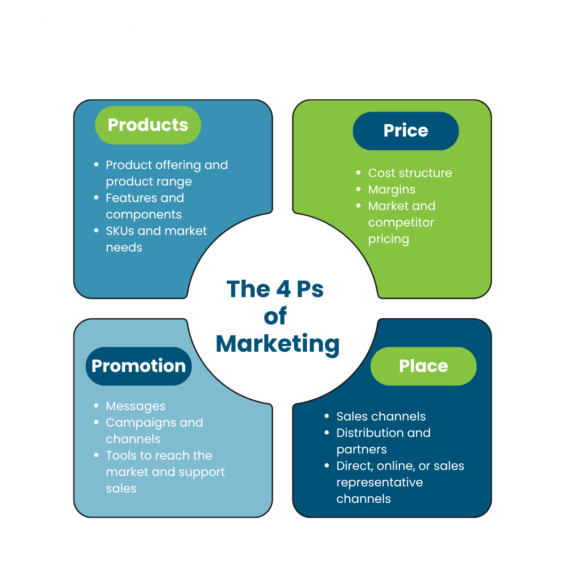
The concept of the marketing mix emerged in the 1950s. E. Jerome McCarthy summarized it as the 4 Ps in 1960. The framework has endured because its four elements are deeply interconnected:
- Product: what exactly are you selling, and what does it include? Start with a complete list of your SKUs.
- Price: do you know your competitors’ prices, your margins, and the cost structure across your ecosystem?
- Place: direct sales, distributors, e-commerce, or sales representatives? The strengths and weaknesses of the partner you choose become part of your own.
- Promotion: which messages, campaigns, channels, and tools will allow you to reach the market and support sales?
The most common mistake is starting with promotion because it is the most visible part of marketing. But promotion can only be effective if the other three decisions have already been made. To review these fundamentals, read “Marketing Explained in 5 Key Concepts”.
Combining the 4 Ps with a SWOT Analysis
A 2023 study by Indonesian researchers (Dermawan et al.) proposes a simple way to make the 4 Ps more rigorous. The authors found that a strategy based solely on the 4 Ps does not account for all internal and external factors. They therefore combined the framework with a SWOT analysis: strengths and weaknesses, which are internal, and opportunities and threats, which are external, identified for each of the 4 Ps.
The method unfolds in three stages. Management first identifies strengths and weaknesses. Partners and product users then identify opportunities and threats. Each factor is evaluated based on its current state and importance, then weighted. The resulting score places the product within a matrix that helps determine the appropriate direction: growth, maintenance, or divestment.
The context studied is different from that of a Quebec manufacturer, but two findings translate directly:
- No strength was identified under price. An empty box is itself strategic information.
- The exercise generated roughly ten potential strategies, which the authors considered impossible to implement within a single year. Prioritization is therefore necessary based on impact and available resources.
Key takeaway: before entering a new market, complete a 4 Ps × SWOT table with your team. Then validate the external factors with a few customers or distributors in the target market.
How Do You Turn Your Options into a Decision?
The tools help clarify your thinking, but making a decision requires trade-offs. Our downloadable decision-making grid structures the process around three components.
Weighted prioritization. Each project is rated from 1 to 5 using seven criteria grouped into three areas:
- Strategic alignment: does the project support your brand promise (BX)? Does it address a real market need (CX)? Do your teams have the skills and buy-in required (EX)?
- Market attractiveness: growth potential and genuine competitive advantage.
- Viability: margins, expected payback period, and the ability to test the idea at a low cost.
The weight assigned to each criterion can be adjusted to your reality.
The combined Ansoff and BCG matrix. This translates your growth strategy and product portfolio into a budgeting approach. Market penetration supported by a cash cow calls for maintaining budgets while optimizing margins. Market development supported by a star or question mark calls for a pilot before a full rollout, with spending tied to specific milestones. Diversification should only be considered with a score above 4.2 out of 5.
The action plan. Evaluate every project with the people responsible for the three experiences: brand, customer, and employee. Put projects scoring below 3.0 out of 5 on hold, including those that offer strong visibility without profitability. Launch small-budget pilots for high-scoring expansion projects. Then apply the 70/30 rule: 70% of resources toward the core business and 30% toward experimentation.
Measure your pilots based on what ultimately contributes to revenue: qualified business opportunities, expected margin, and payback period. The number of visits or contacts is only an early indicator. This approach extends the thinking presented in our article “Prioritize, Decide, Act: Tools to Turn Ideas into Impact”.
Common Pitfalls That Can Derail Market Diversification
- Confusing visibility with profitability. A strong-looking pipeline can hide operating costs that make a market unprofitable.
- Skipping real-world validation. Market research cannot replace trade missions and industry events tested through a pilot approach. The stronger your network is before launch, the lower the cost of market entry.
- Looking elsewhere before fully developing your existing customer base. Your current customers often represent the most accessible growth opportunity.
- Freezing investments while waiting for uncertainty to pass. Waiting is rarely neutral: it gives others more room to move.
Your Starting Point in Five Steps
- Classify your current products within the four quadrants of the BCG matrix.
- Choose the growth project that requires the most clarity and place it within the Ansoff matrix.
- Complete the 4 Ps × SWOT table for that project.
- Score it using the decision-making grid with your management team.
- Define the smallest possible test that would validate your hypothesis.
Taking Action
Diversification Starts with Choosing
Diversification does not mean changing everything. In most of the cases we work on, the core offering remains the same. What changes are the markets, segments, and channels.
No tool can eliminate uncertainty. What these tools change is what you are able to learn from your decisions. When an improvised decision fails, it often tells you very little about why. A structured decision, tested through a pilot and measured against clear milestones, tells you what needs to be adjusted. A low score is not a reason to push ahead anyway. It is a signal that something needs to be strengthened before moving forward.
To assess your level of alignment and agility before entering a new market, our free online diagnostic can help identify areas of misalignment that may be slowing down decision-making. And if you are wondering how this approach could apply to your own portfolio, a strategic discussion with our team can be a good place to start.
Category
Share